What can Adverserial Validation do for you?
Explanation from my experience in Fraud Detection competition
Introduction
Adverserial Validation is a simple technique that helps distinguish the difference in the train and the test data. In this kernel, I show how to do AV with a simple example. It involves the following steps:
- Concat the train and the test data set.
- Append a new column “is_test”.
- Split data into training and validation.
- Train model and get AUC score on
istest==1for the validating set.
AV can identify out-of-domain data
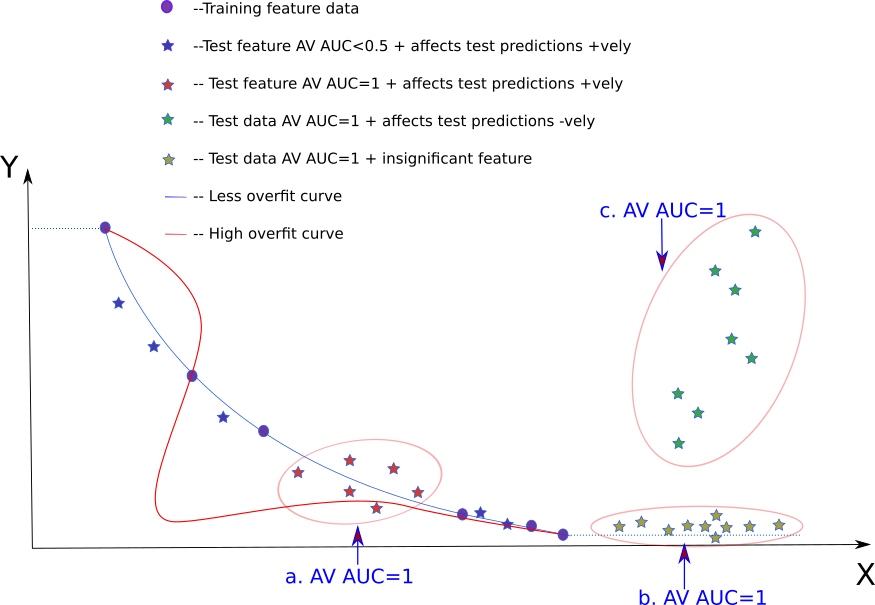
In the image above, the circles (blue) denote training data. The blue
line denotes the line fit. Red line denotes an overfit line. Different
colored stars (blue, green, red, yellow) denote different types of
test data. Y is the dependent variable and X is the independent
variable. The dotted blue line indicates the predicted value in case
the data lies beyond the training bounds.
The three regions marked in “big bubbles” are where there is no
training data and hence these are out-of-domain data regions. We
simply get a very high AUC score (AUC=1) from AV for these (red,
green and yellow stars). In this kernel it is checked with an
example that the “big bubbles” in the image above have AV AUC=1.
AV AUC=1 and how they affect test predictions
When the test set is denoted by the green stars, it is clear that the
resulting test score is going to be “bad”. However, when the test set
is denoted by the yellow stars, error in predicting seems to be less
in comparison (despite having AV AUC=1). When the test set is
denoted by the red stars the error doesn’t seem to be that bad either
AV AUC=1.
From the beginning to the end for this competition, I had >0.9 AUC,
and nevertheless ended up with very good results (0.953–>top 10%). In
addition the OOF score (from training) was less than the TEST score
informing that the OUT-OF-DOMAIN data was not the problem for the
score. I am thus inclined to think that in my case I probably end up
with test data which are out of domain like the red and yellow stars
and not like the green stars.
How AV is used in the Fraud Detection kaggle competition
-
Identify and Remove time columns like
TransactionIDandTransactionDTWhen AV is first run on this dataset, two columns standout:
TransactionDTandTransactionID. One is the time info in seconds and the other is the id of each transaction. Ideally we don’t want to be using such time columns as we don’t want the model to learn anything specific to the Date or the ID of transactions. AV provides a platform to identify such variables and eventually we can get rid of them. -
Removing very different columns for negligible score loss.
In one of the iterations I had 203 columns with an lb score of
0.953. Removing 20 of the most important AV columns resulted in a small decrease in score0.9511. I always try to see how the “out of domain” data affects our result. -
AV helps find aggregations that we need
This is and will be the greatest reason for doing AV. AV is so powerful that improving my score from top 80% to a top 10% score was done purely by looking at the important AV columns.
I pretty much used the first 10-20 important AV columns (and a few columns on my own) to determine which columns to choose as UID and which to aggregate over.
-
Find mistakes with your AV
I applied aggregation to the training dataset and accidentally did not apply it to the test. This was promptly visible in the AV as the aggregated columns showed up first in the “AV important columns”. A quick look at the top AV important columns and I found my error.
For example, in one of the experiments I got the following:
train OOF test (public) AUC 0.9971 0.9426 0.9043 From this it is possible to infer that there is both overfitting (train»OOF) and Out of Domain issue (OOF»test). Using AV, I was able to find out which columns were giving me the problem. When I probed in deeper into the columns, it turned out that I had accidentally added NaN’s to the test data.
Once I corrected for it, I ended up with:
train OOF test (public) AUC 0.998 0.9474 0.9530